GeoXplain
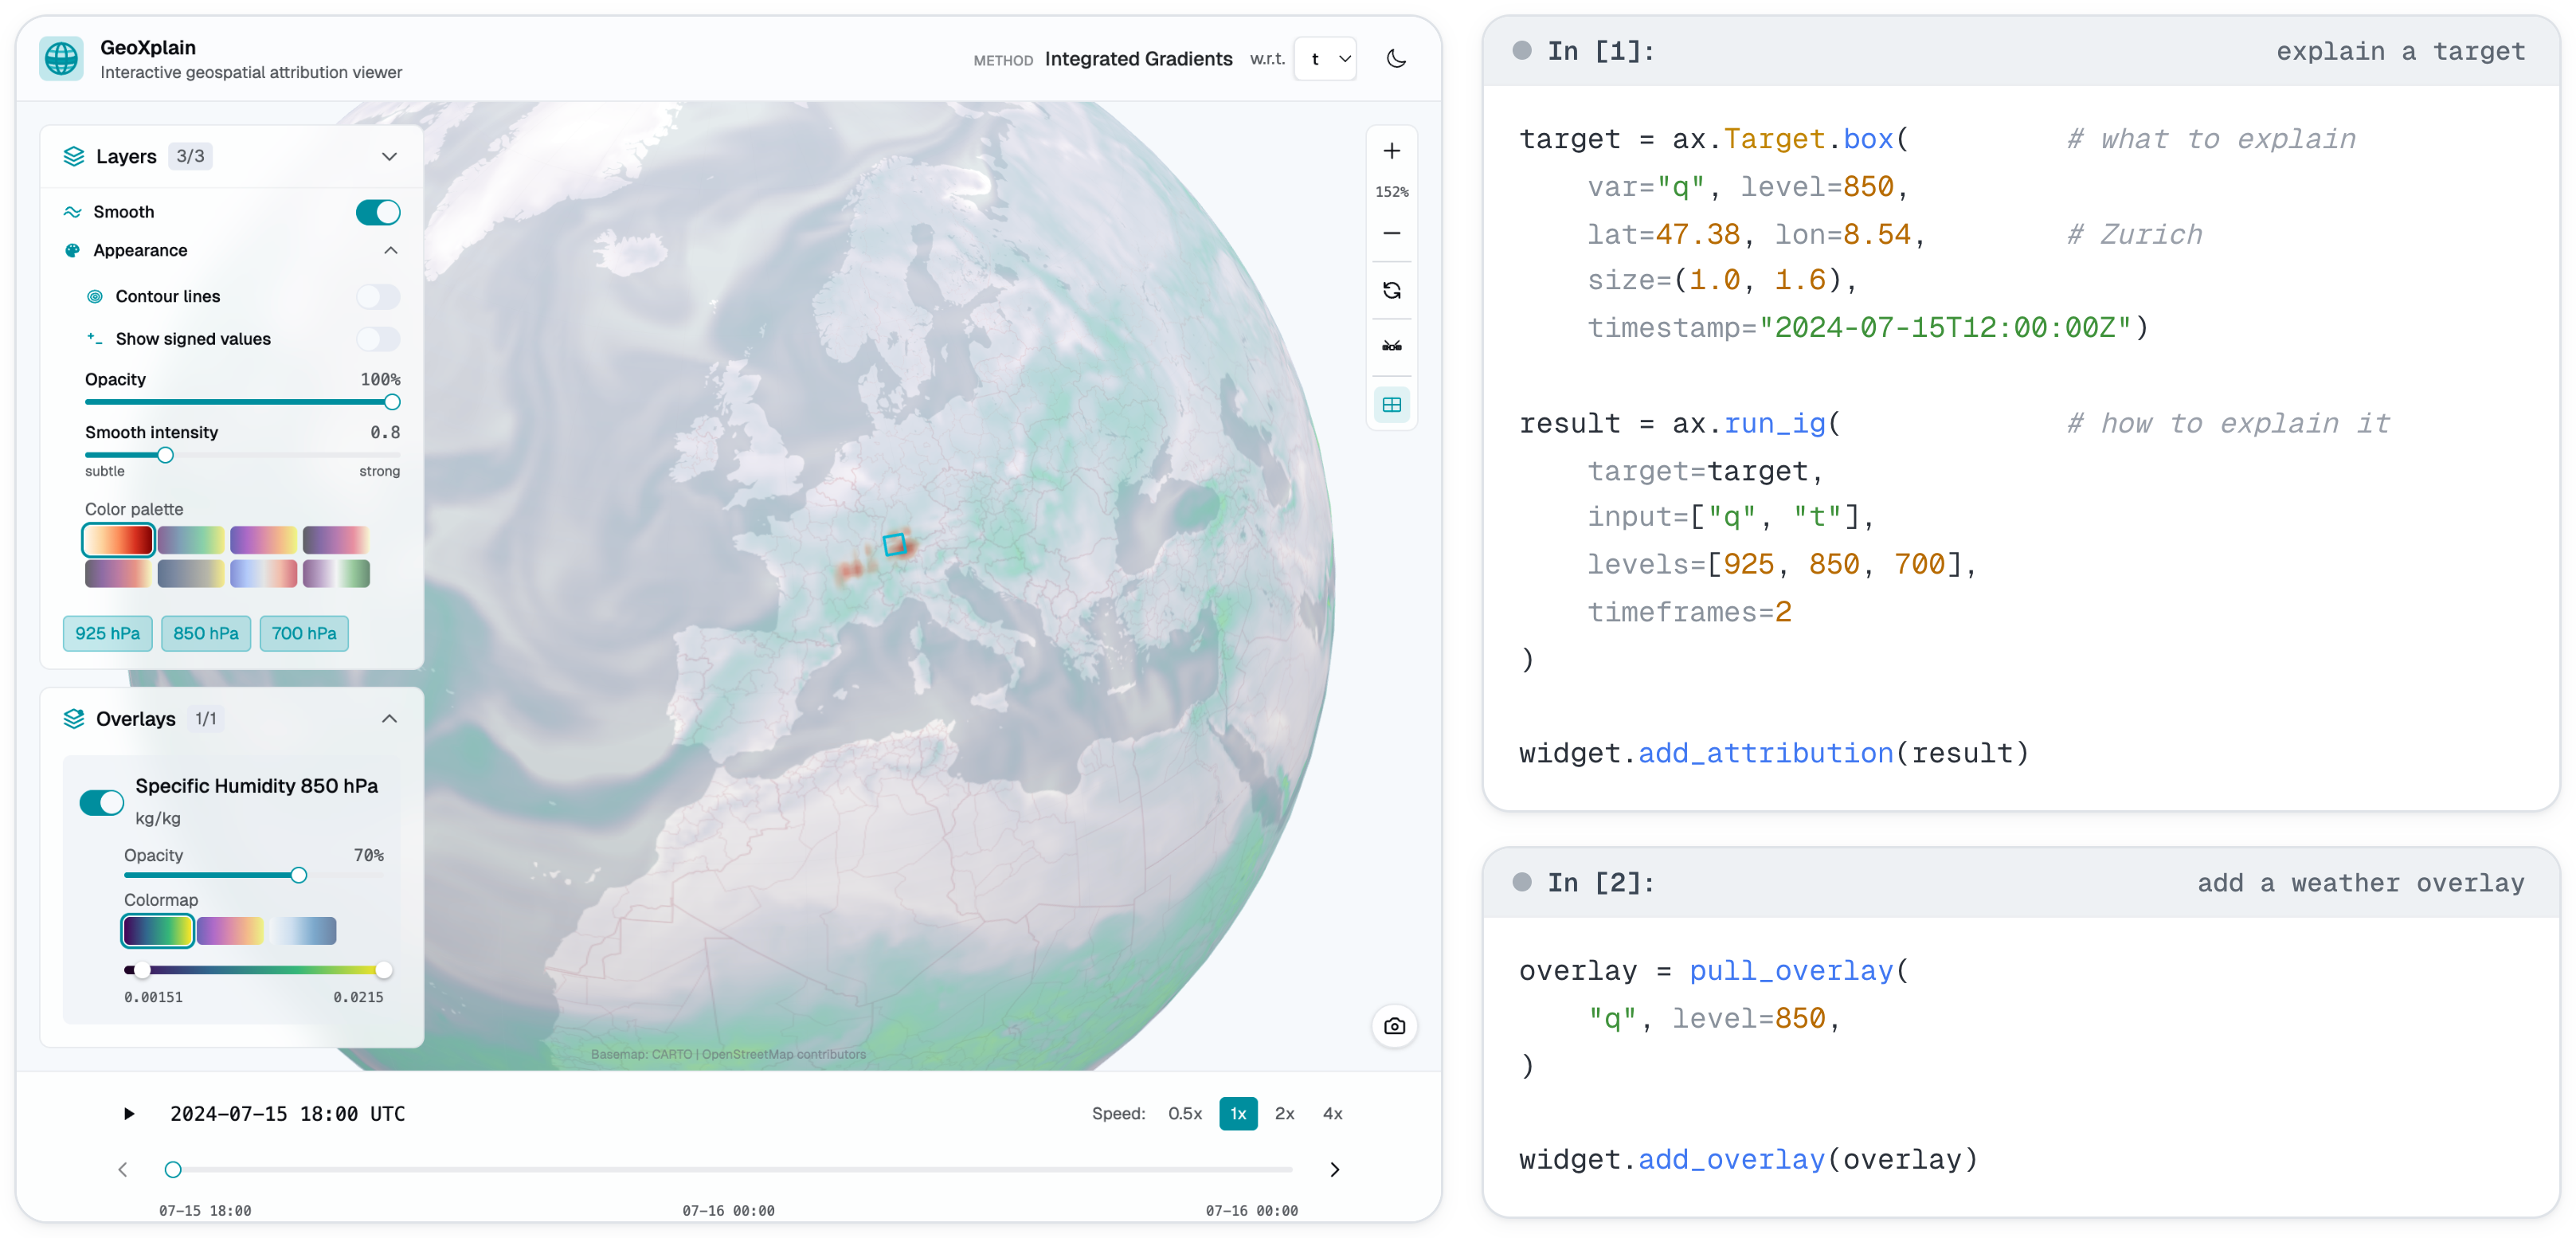
GeoXplain is a interactive Python-based visualization toolkit for exploring geospatial attribution maps across climate variables, atmospheric pressure layers, and forecast time. The geoxplain package accepts raw arrays or objects that satisfy its small result protocols, then lets you compare attribution methods, variables, vertical levels, and time frames in a Jupyter widget or standalone browser viewer.
Explanation computation is deliberately outside the viewer. You can use your own model and XAI library, load a saved .xia.npz bundle, or connect a model-specific backend. The first packaged backend is geoxplain-aurora-adapter, which computes explanations and weather overlays for Microsoft Aurora locally or through a remote listener.
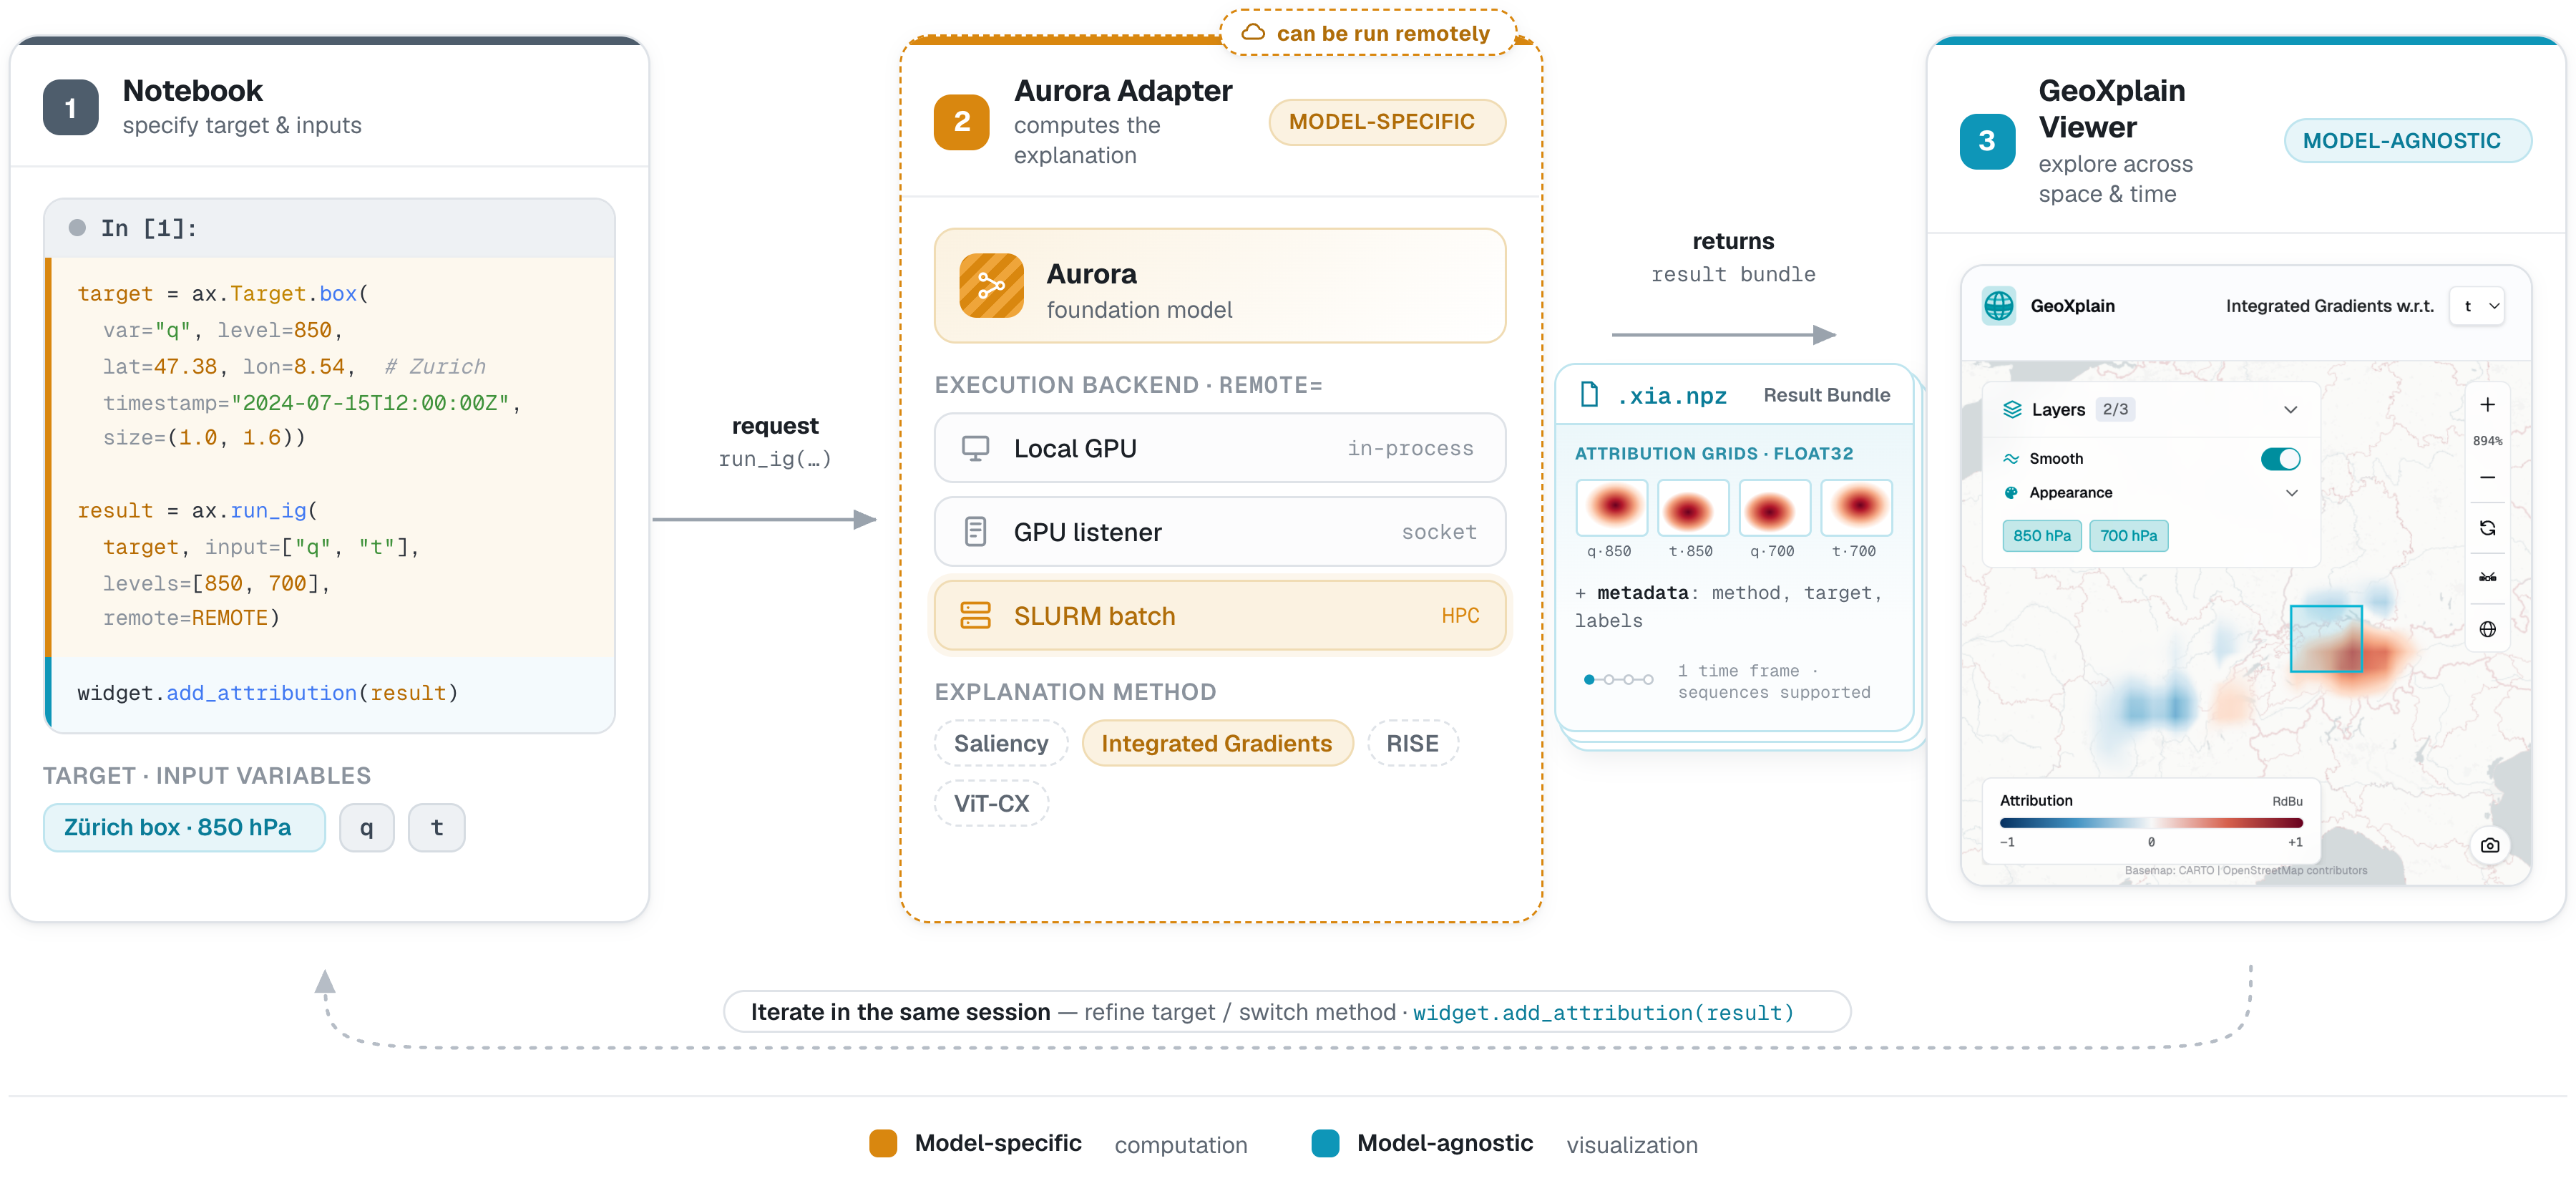
A single workflow in three stages. In the notebook (1) you specify a target and input variables. A model-specific backend such as the Aurora adapter (2) computes the explanation — locally, on a GPU listener, or on an HPC batch queue — and returns a self-describing .xia.npz result bundle. The model-agnostic GeoXplain viewer (3) explores that result across space, pressure levels, and forecast time. Refining the target or switching methods stays in the same notebook session.
Choose the right entry point
| Goal | API |
|---|---|
| Add an attribution from any model | GeoXplainWidget.add_attribution() |
| Display results in Jupyter | geoxplain.GeoXplainWidget |
| Open or export a standalone viewer | geoxplain.GeoXplain |
| Load a saved attribution bundle | geoxplain.xia_result.load_xia_result() |
| Load a saved overlay bundle | geoxplain.overlay_result.load_overlay_result() |
Start without a backend
GeoXplain can visualize an attribution produced by any model or explanation library. No compute adapter is required:
import numpy as np
from geoxplain import GeoXplainWidget

attribution = np.load("my_model_saliency.npy")

widget = GeoXplainWidget(title="Model attribution")
widget.add_attribution(
    attribution,
    level="sfc",
    method="Saliency",
    timestamp="2024-03-20T00:00:00Z",
    target=(46.25, 8.75),
)
widget
For several levels, variables, methods, or time frames, add more arrays or provide a XiaResult-compatible object. GeoXplain does not need to know which model produced them.
End-to-end example with the Aurora backend
The optional Aurora backend adds target construction, explanation methods, data loading, and local or remote execution:
import geoxplain_aurora_adapter as ax
from geoxplain import GeoXplainWidget

target = ax.Target.box(
    var="q",
    level=850,
    lat=46.25,
    lon=8.75,
    size=(1.5, 2.5),
    timestamp="2024-03-20T00:00:00Z",
)

result = ax.run_saliency(
    target=target,
    input=["t", "q", "z"],
    remote="http://localhost:8765",
)

widget = GeoXplainWidget(result=result)
widget
Without remote=, computation runs in the notebook process and requires a visible GPU. Supplying a listener URL keeps the same Python call site while moving computation to a GPU or SLURM-backed service.
Bring your own model
The viewer works with any backend that produces compatible results, and the Aurora adapter is designed to be a template: clone it, swap the model, data loading, and targets, and keep the dispatch, remote execution, and serialization machinery. See adapt the adapter to another model.
Documentation map
- Start with the quickstart to load an existing result.
- Use visualize results for arrays, level mappings, result bundles, browser export, and screenshots.
- Read the data model when integrating another compute backend.
- Consult the generated Python API reference for exact signatures.
- Read Aurora as a backend before using its computation and remote-execution guides.